
The Two Views (with the numbers explained)
Uservox Analytics shows the same data through two views. They look similar but answer opposite questions, because each is anchored on a different date:- Dashboard is anchored on the call attempt date — when a call was made.
- Leads Dashboard is anchored on the lead insertion date — when a lead was added.
1. Dashboard (Activity view)
- Anchored on: the call attempt date
- Answers: “How much calling did we do, and how did it convert?”
- Counts: every lead touched in the time window, no matter when it was added (a lead uploaded weeks ago but dialed today is counted today).
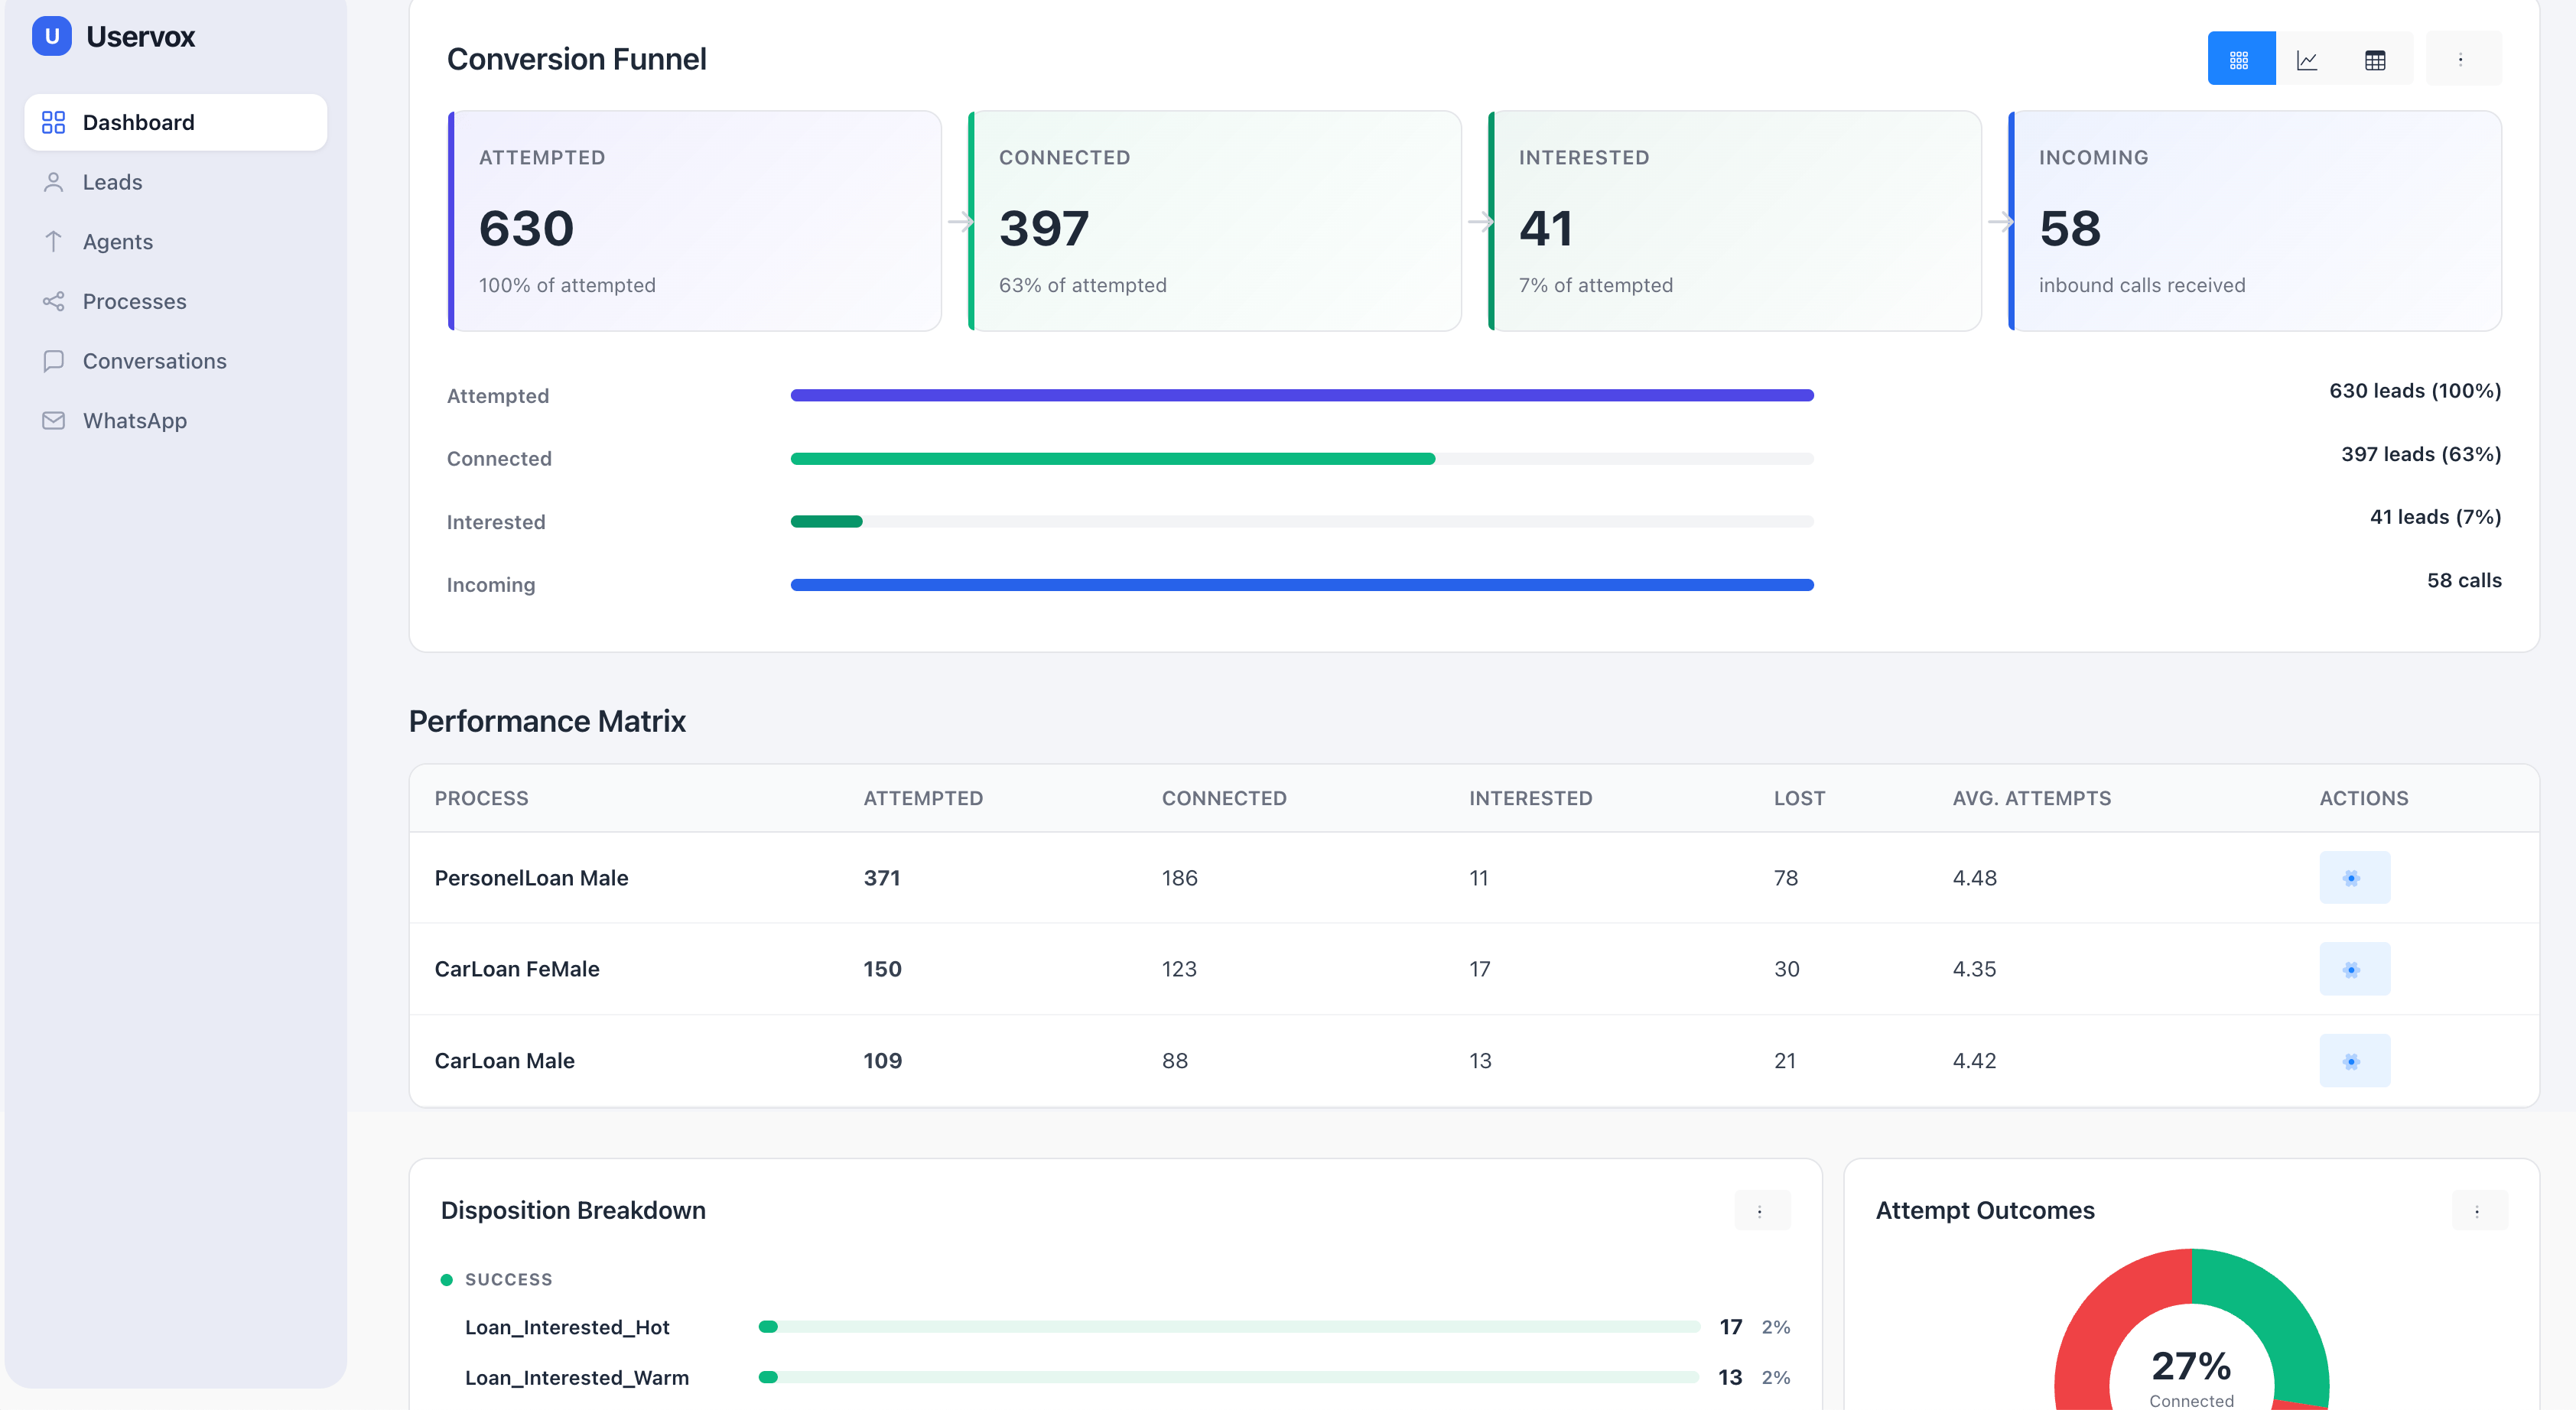
What the numbers in this snapshot mean
Conversion Funnel- Attempted — 630 (100%): 630 leads received at least one call attempt in the window. This is the base for every percentage in the funnel.
- Connected — 397 (63%): of those 630, 397 answered. 397 ÷ 630 = 63%.
- Interested — 41 (7%): 41 of the attempted leads expressed interest. 41 ÷ 630 ≈ 7%.
- Incoming — 58: 58 inbound calls were received. This is a separate inbound counter, not part of the outbound funnel.
- Attempted / Connected / Interested sum exactly to the funnel (630 / 397 / 41), confirming the funnel is just the total of these three processes.
- Avg. Attempts ~4.4 means each lead was dialed roughly four to five times on average before an outcome.
- Interested_Hot — 17 and Interested_Warm — 13: the specific tags behind the “interested” outcomes recorded in this activity window.
- 27% connected: this is measured per dial, not per lead. Because each lead is dialed ~4.4 times, only about 27% of individual dials connect — even though 63% of leads eventually connect across all their attempts.
Use it to
- Track daily or weekly throughput.
- Check the connect rate on calls actually made.
- Spot processes using too many attempts per lead.
- Watch inbound call volume.
2. Leads Dashboard (Cohort view)
- Anchored on: the lead insertion date
- Answers: “How is the batch of leads we acquired performing?”
- Counts: a fixed cohort of leads by upload date, tracked over time — regardless of when the calls behind those outcomes happened.
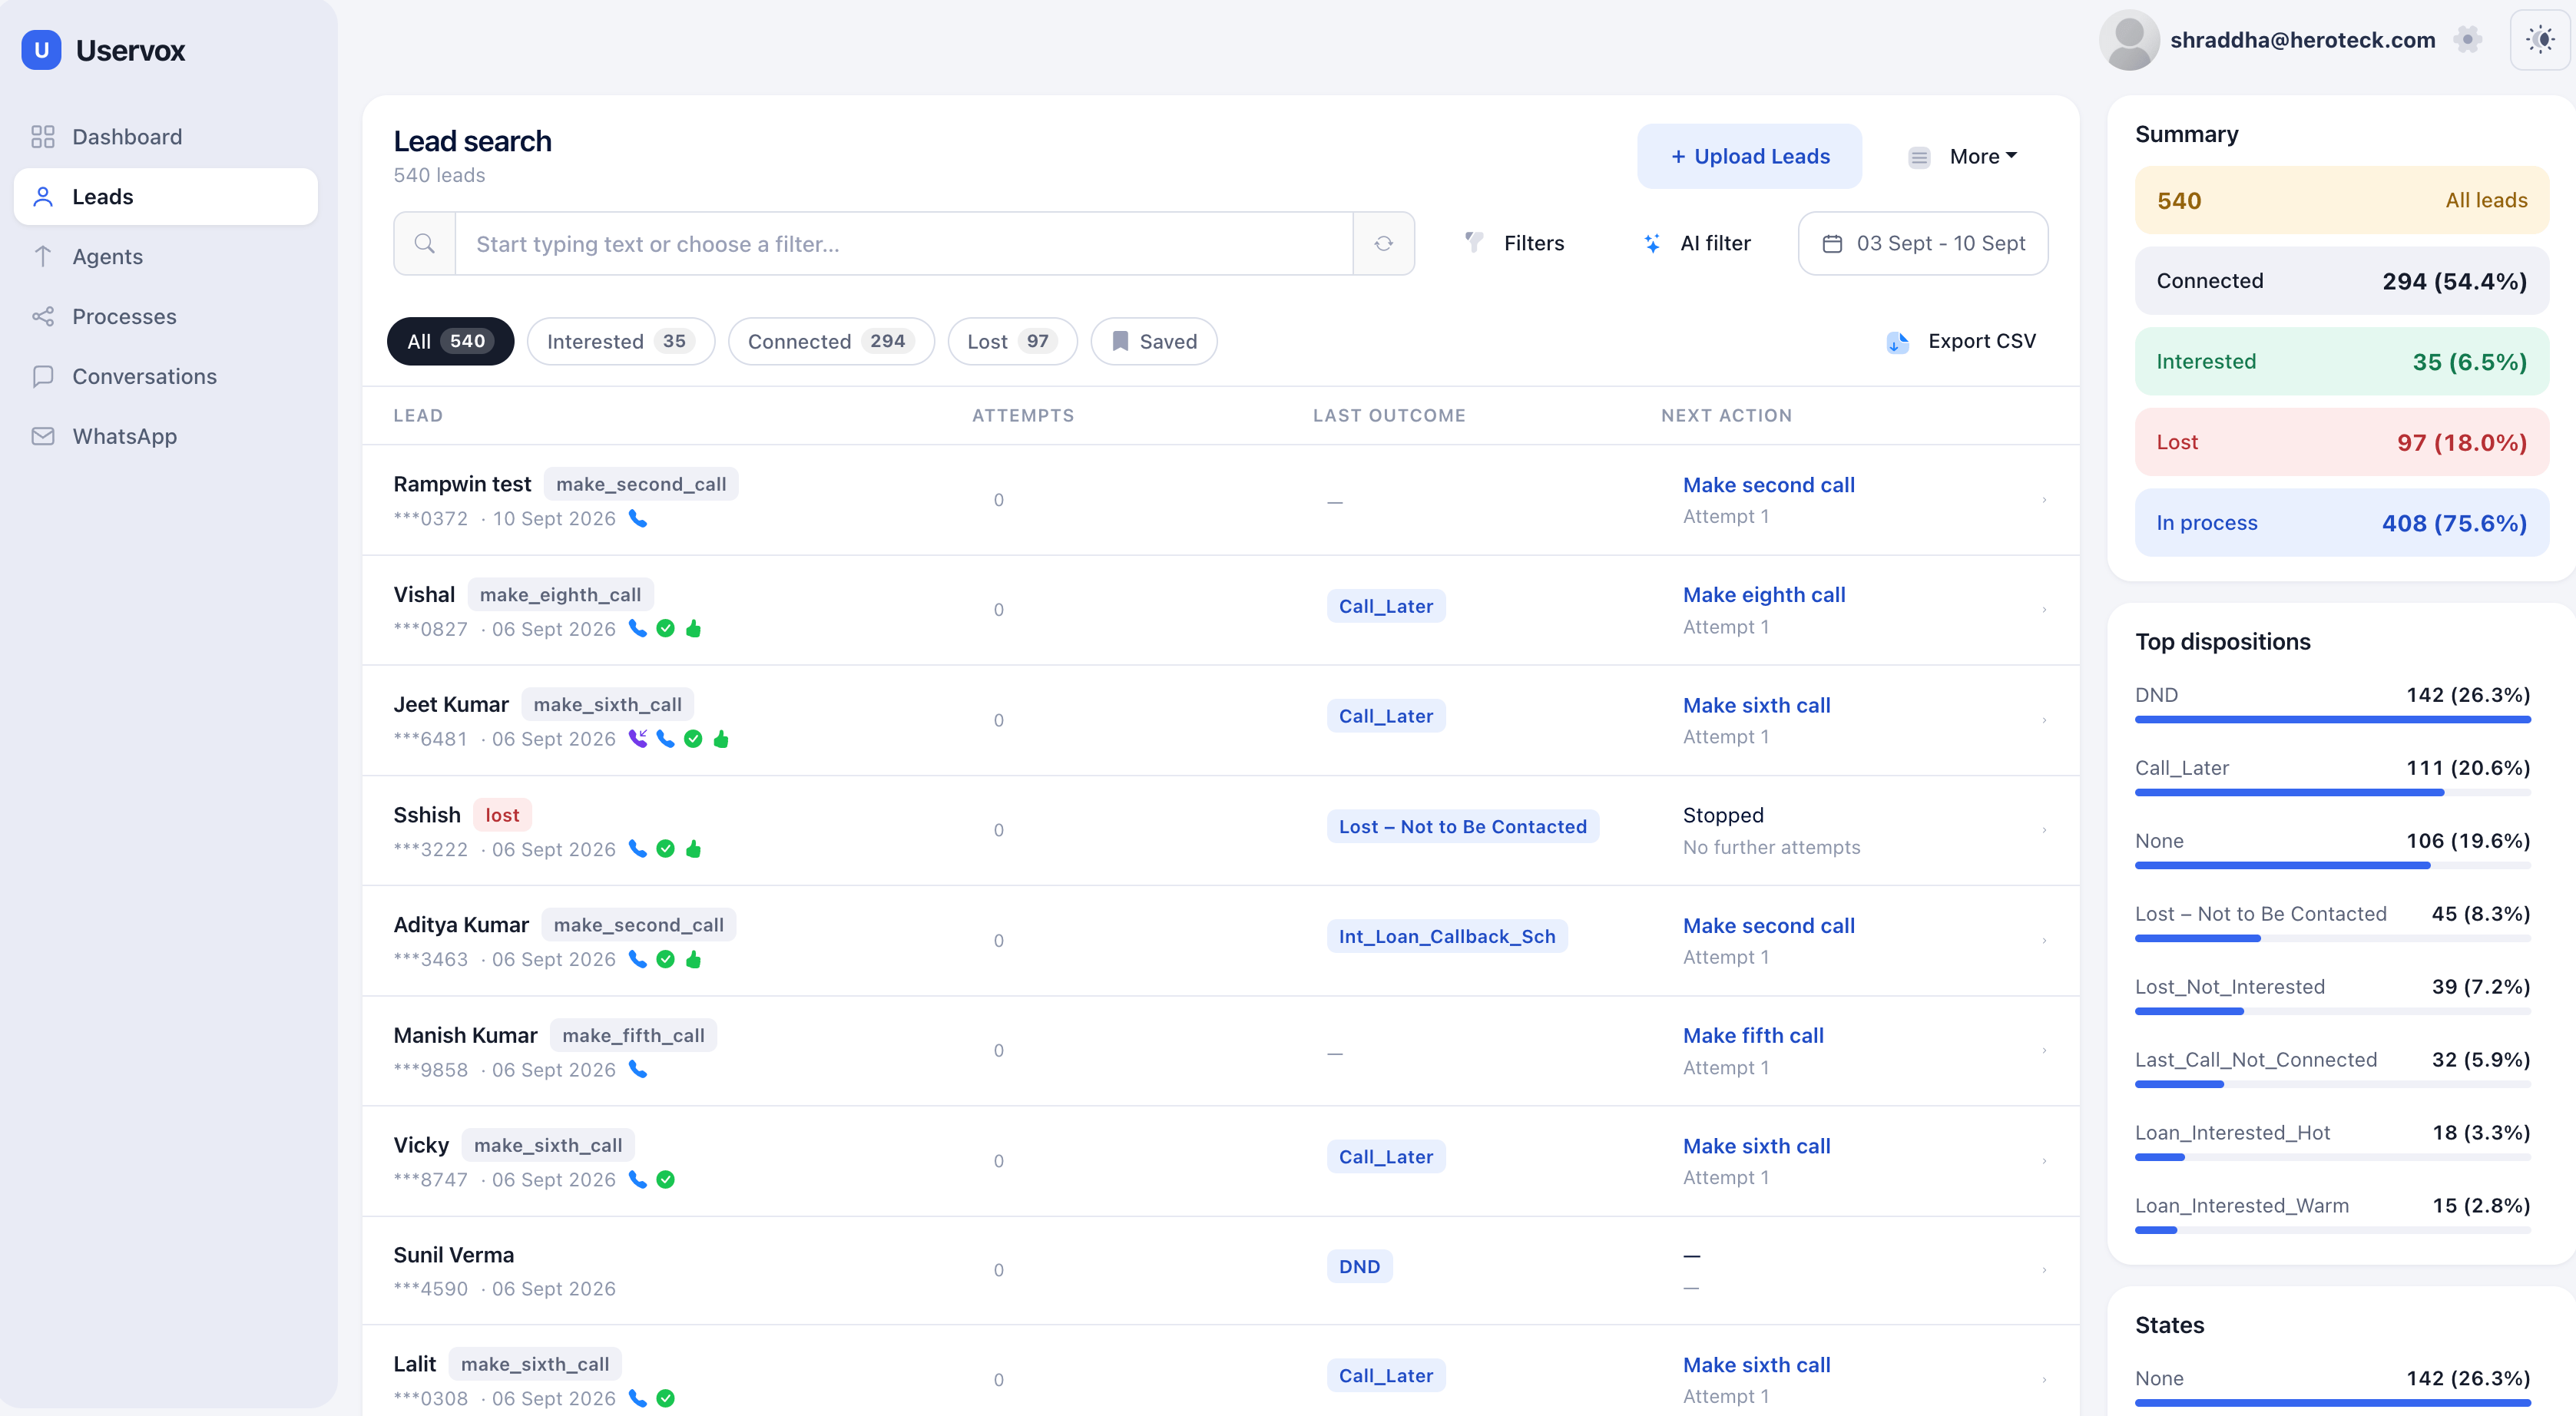
What the numbers in this snapshot mean
Summary — everything here is a share of the 540-lead cohort (leads inserted 3–10 Sept):- All leads — 540: the total inserted in the range. This is the base.
- Connected — 294 (54.4%): 294 of the 540 have connected at least once. 294 ÷ 540 = 54.4%.
- Interested — 35 (6.5%): 35 expressed interest. 35 ÷ 540 = 6.5%.
- Lost — 97 (18.0%): 97 are closed as lost. 97 ÷ 540 = 18.0%.
- In process — 408 (75.6%): 408 are still active in the pipeline. This overlaps with Connected — a lead can be connected and still in process — which is why these figures don’t add to 100%.
- DND — 142 (26.3%): largest bucket; numbers on the do-not-disturb list.
- Call_Later — 111 (20.6%): asked to be called back later.
- None — 106 (19.6%): no disposition yet — not reached so far.
- Lost – Not to Be Contacted — 45 (8.3%)
- Lost_Not_Interested — 39 (7.2%)
- Last_Call_Not_Connected — 32 (5.9%)
- Interested_Hot — 18 (3.3%)
- Interested_Warm — 15 (2.8%)
- None — 142 (26.3%): leads that haven’t advanced into a pipeline state yet.
Use it to
- Judge the quality of an acquired batch (DND vs interested).
- See how far a cohort has moved (in process vs lost).
- Pull the working list of leads with their next action.
Why the same label shows different numbers
The two snapshots deliberately disagree, because they count different populations over different date anchors. For example:
This is expected. The numbers are not errors — they’re two different questions being answered.
Reading the connect rates
“Connected” appears in both views but is measured against a different base each time, so the percentages are not meant to match — and should not be compared directly:- 63% — Dashboard funnel — of leads dialed in the window.
- 27% — Dashboard donut — of individual attempts.
- 54.4% — Leads Dashboard — of leads inserted in the range.
In short
- The Dashboard is about throughput — what you did.
- The Leads Dashboard is about cohort quality — what you got.
- One lead can appear in both: it joins the Leads Dashboard the day it’s uploaded and stays in that cohort, and it shows on the Dashboard whichever day it’s actually dialed.