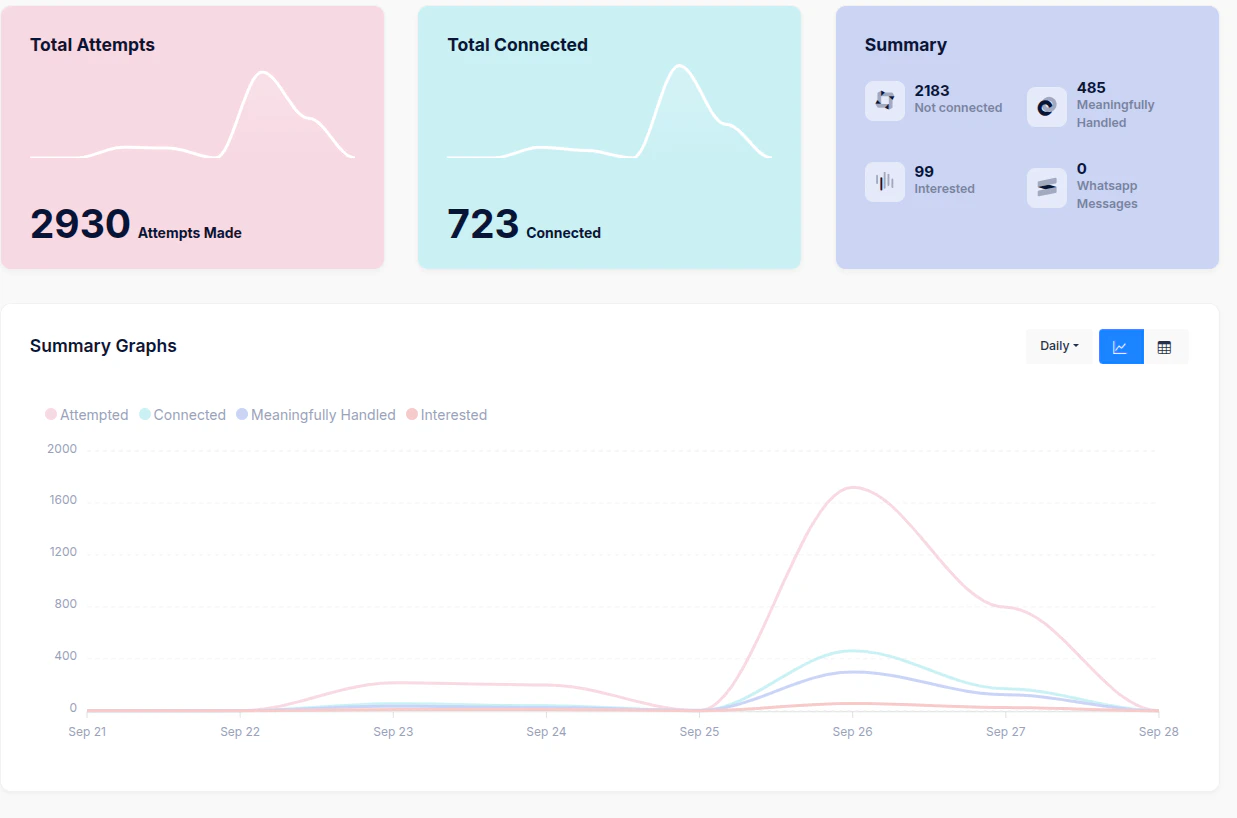
1. Key Metrics
- Total Calls (Daily)
Number of outbound calls attempted on a given day, across all leads (new or old). - Connected Calls
Number of calls successfully connected (customer picked up). - Interested Calls
Subset of connected calls where the lead expressed interest. - Lost Calls
Calls that resulted in disqualification, wrong number, or explicit non-interest. - Not Concluded
Calls that are pending follow-up, callback scheduled, or where the customer didn’t provide a clear response.
2. Conversion Indicators
- Daily Conversion Rate (Connected → Interested)
Percentage of connected calls that converted into interest.
Formula = Interested Calls ÷ Connected Calls. - Daily Interest Rate (Total → Interested)
Percentage of all calls attempted that resulted in an interested lead.
Formula = Interested Calls ÷ Total Calls.
3. Call Pulses (Usage Metrics)
- Pulse Definition:
Every outbound call is measured in pulses for billing and tracking purposes.- 1 pulse = 1 minute
- Calls between 0–59 seconds are counted as 1 pulse.
- Calls of 60–119 seconds are counted as 2 pulses, and so on.
- Daily Pulse Count:
The dashboard shows the total number of pulses consumed per day, giving users visibility into actual call-time utilization. - Pulse Efficiency:
Average duration per connected call (pulses ÷ connected calls) can be used to benchmark agent efficiency.
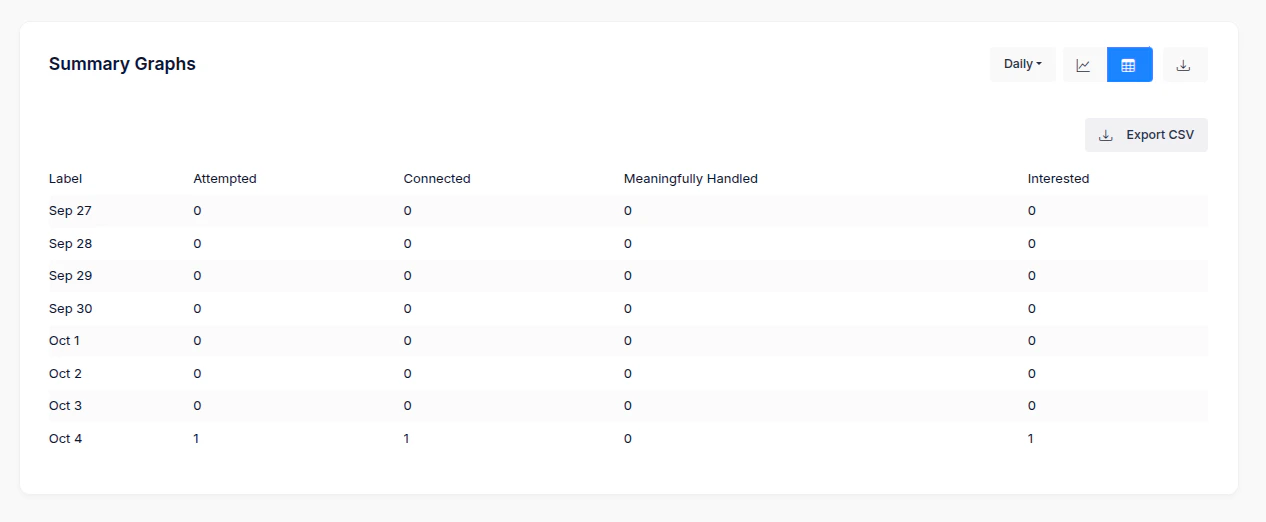
4. Example Daily Flow
Day: Sep 27, 2025- Total Calls: 500
- Connected Calls: 180
- Interested Calls: 30
- Lost Calls: 120
- Not Concluded: 50
- Pulses Consumed: 520
- 36% connectivity rate (180 ÷ 500).
- 16.6% of connected leads showed interest (30 ÷ 180).
- Average call length = 520 pulses ÷ 180 connected ≈ 2.9 minutes.
5. Why the Daily Dashboard Matters
- Real-Time Monitoring – Gives daily visibility into lead response trends.
- Resource Management – Tracks call volume and minutes spent per day.
- Performance Benchmarking – Allows teams to compare one day’s efficiency and conversion to another, regardless of when leads were inserted.
- Billing Transparency – Daily pulse data ensures clarity on usage-based costs.