Cohort Based Process Analytics
Cohort Analytics in UserVox.ai helps users understand how their leads are being processed over time. All metrics are calculated cohort-wise, meaning they are tied to the lead insertion date (the day the lead first entered the system). This ensures that analytics are comparable across different lead batches.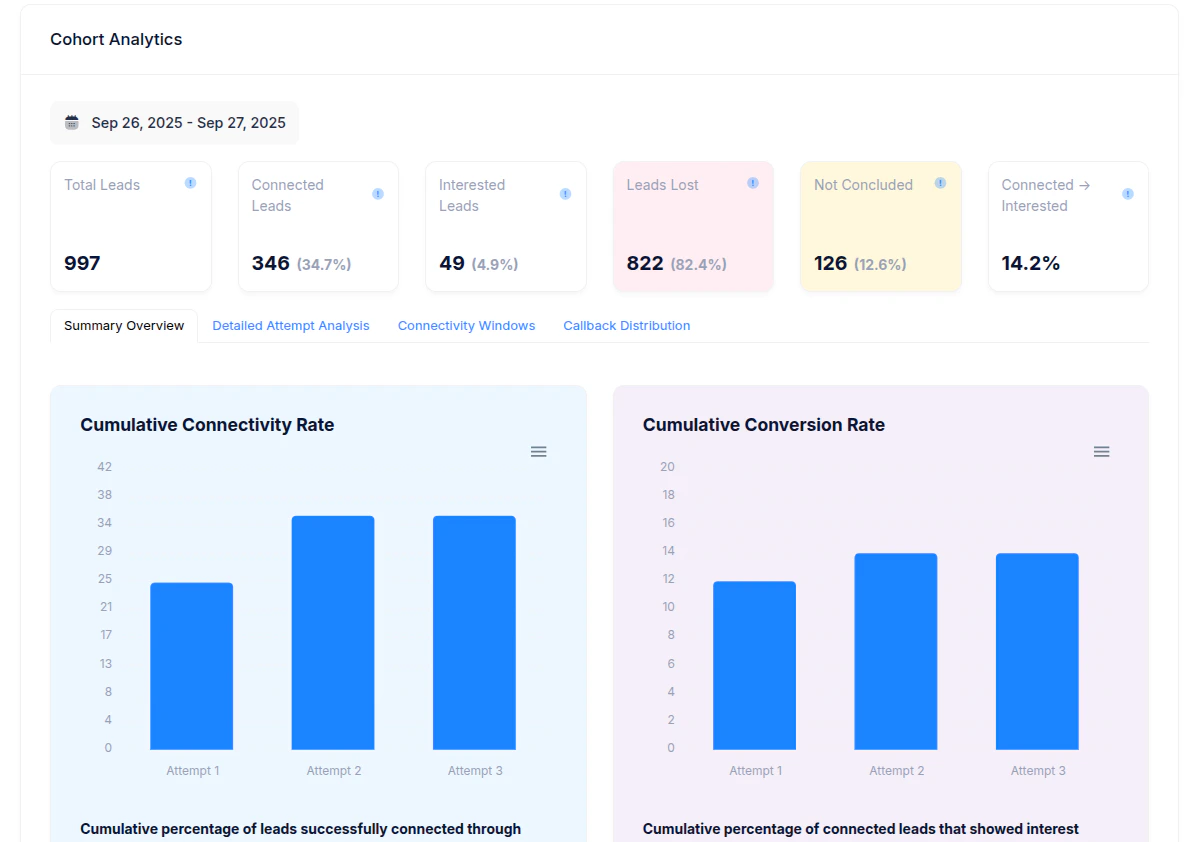
1. Key Metrics
- Total Leads
The number of leads inserted into the system for the selected cohort/date range.
Example: 997 leads were added between Sep 26–27, 2025. - Connected Leads
Leads where at least one successful connection was made (the customer picked up the call).
Percentage shown = Connected Leads ÷ Total Leads. - Interested Leads
Subset of connected leads that showed positive intent (e.g., interested in the product, requested callback, or confirmed visit). - Leads Lost
Leads marked as not interested, disqualified, wrong number, or dropped off during the conversation. - Not Concluded
Leads that could not be classified as interested or lost (e.g., still open, callback scheduled, pending decision). - Connected → Interested (%)
Conversion rate of connected leads into interested leads.
Formula = Interested Leads ÷ Connected Leads.
2. Connectivity & Conversion Charts
- Cumulative Connectivity Rate
Shows the percentage of total leads that were successfully connected after each attempt.
Insight: Connectivity improves sharply by the 2nd attempt, with marginal gains after that. - Cumulative Conversion Rate
Shows the percentage of connected leads that expressed interest after each attempt.
Insight: Conversions typically stabilize after the 2nd attempt.
3. Detailed Attempt Metrics
Each attempt shows how leads performed when retried: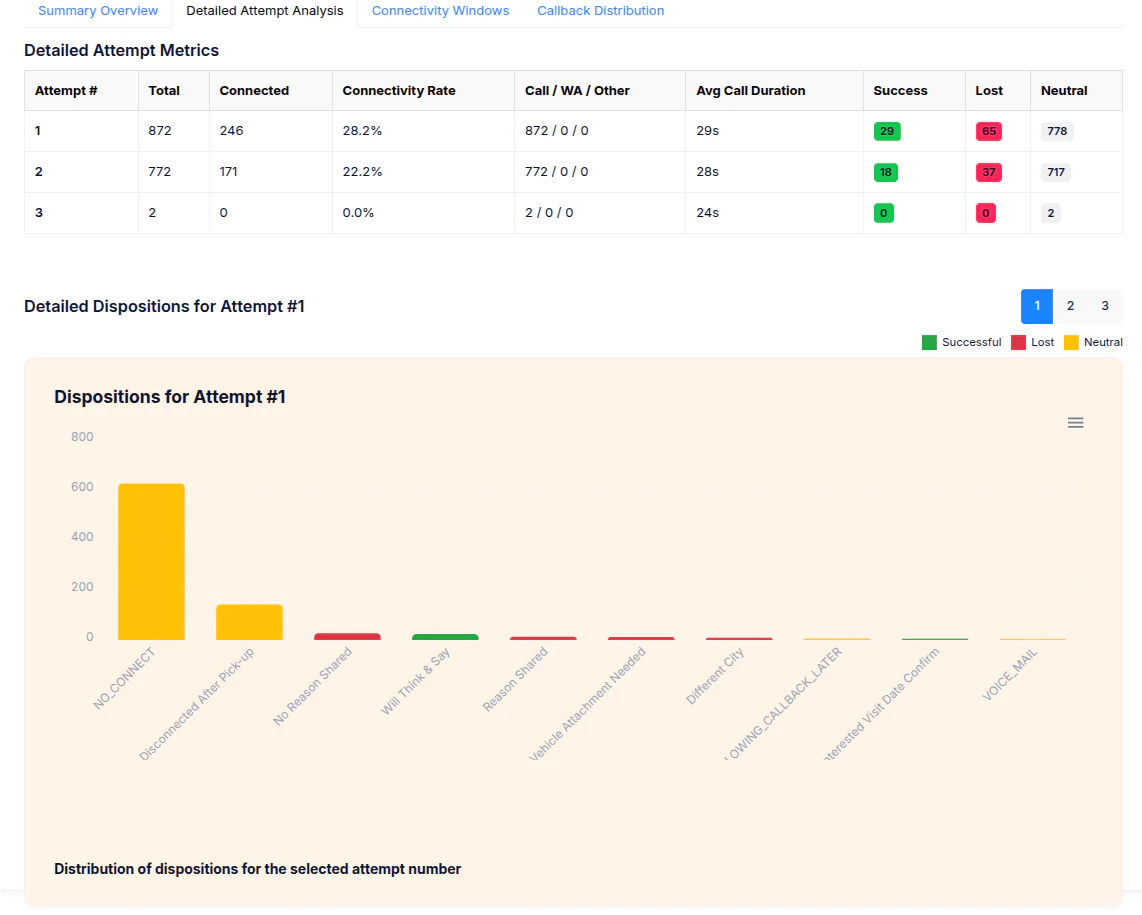
- Total – Number of leads dialed in that attempt.
- Connected – How many were successfully connected.
- Connectivity Rate – Connected ÷ Total for that attempt.
- Avg Call Duration – Average time spent per call (useful for efficiency tracking).
- Success / Lost / Neutral – Outcomes:
- Success = Interested
- Lost = Disqualified / Not Interested
- Neutral = Pending / Callback / No Connect
4. Dispositions
Dispositions explain where a lead ended up in a certain status. Examples include:- No Connect
- Interested - Ready to Buy, Booked visits, etc
- Not Interested - Lost, Not ready to buy, etc
5. How Cohort Analytics Works
- Every metric is tied to the lead insertion date.
- For example, if 500 leads were inserted on Sep 26 and 497 on Sep 27, the analytics will show how these leads progressed through connectivity and conversion stages, independent of older or newer cohorts.
- This makes it easy to compare lead quality and process efficiency across different days, campaigns, or sources.
6. Why It Matters
- For Sales Teams: Quickly see how many leads are converting and at which attempt.
- For Operations: Identify high “No Connect” rates and improve retry/alternate channel strategies.
- For Management: Benchmark performance across cohorts to optimize lead sourcing and agent scripts.